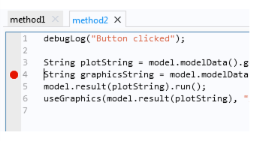
The Application Builder includes some tools for debugging the code in methods used by an application. This functionality is available from the Debug and Breakpoints sections of the Method ribbon toolbar.
To remove a breakpoint, click on it again. All breakpoints can be removed in one action by using the Remove All ( ) button in the Breakpoints section of the Method ribbon tab. Sometimes it is convenient to be able to make the test run of an application ignore the existing breakpoints. In that case, you can disable all breakpoints using the Disable All (
 ) toggle button. Disabled breakpoints are indicated by an empty red circle.
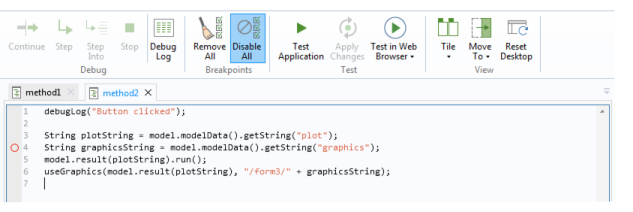
If you run a method during the test run of an application, the method editor window is open, and the method has an enabled breakpoint, then the method will stop running on the line of the breakpoint. The entire line then becomes highlighted in yellow, and the Continue ( ), Step (
 ), and Step Into (
 ) buttons are enabled in the Debug ribbon tab. The Continue and Step buttons are only available when the debugger has paused.
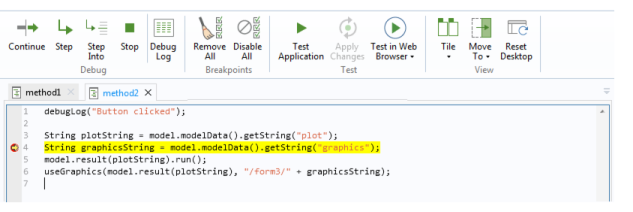
If you click the Continue button (or press F5), the method continues to run until it completes or reaches another breakpoint. If you click the Step button (or press F6), the method continues to run until the next line, where it stops again, giving you the options to continue or step. The Step Into button works in the same way as the Step button, but if the line contains a call to another method or utility method, clicking Step Into (or press F7) then takes you to the first line in that method instead of continuing to the next line in the current method. There is also a Stop button ( ), which is available when you have started to run a method. Clicking it forces the running of the current method to stop. It can be useful if you want to stop the debugging run immediately or if the method has run into some endless loop, for example.
Often it is useful to print messages that indicate that a line of code has been reached or to print the value of a certain object. You can do this using the debugLog method. There are debugLog methods that take a String, double, int, or boolean, or 1D array or 2D array (matrix) types of these objects as input. These methods print a message to the Debug Log window. You can control the visibility of the Debug Log view using the Debug Log ( ) button in the Method ribbon tab.