|
|
|
•
|
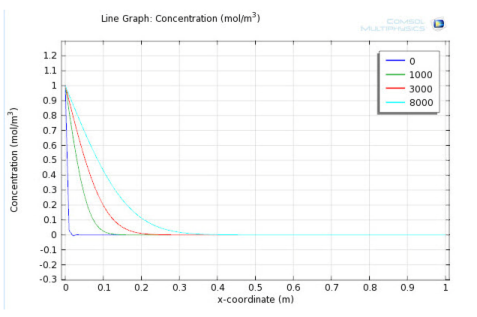
Avoid displaying small unphysical values due to numerical noise by clipping the values for the plot. You can do this by plotting, for example, c*(c>0) instead of c, which evaluates to 0 everywhere where c is smaller than 0. You can also adjust the range of the plot data and colors to only show nonnegative values. Parts of the plots where values are outside the range then become empty.
|