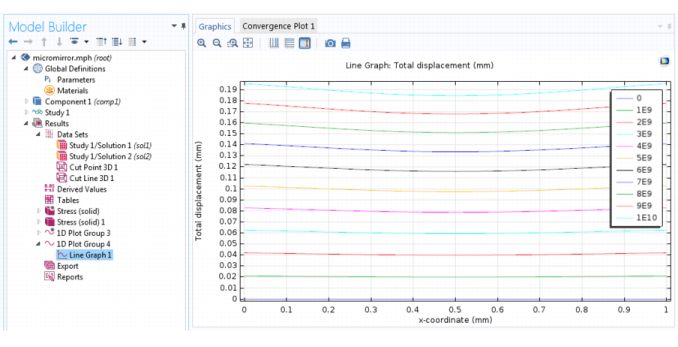
A 3D line/extrusion cross-section plot visualizes a quantity in one or several lines in time, along a parameter range, or for several eigenvalues. This example uses the Prestressed Micromirror model from the MEMS Module Applications Libraries.
|
1
|
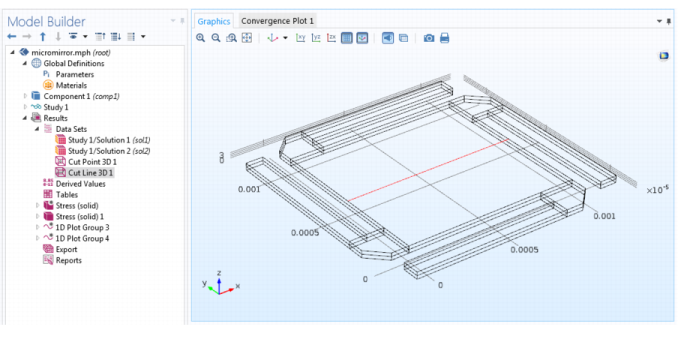
Create a Cut Line 3D data set. Enter the 3D coordinates for the plot. Set the start and end point of the line under x, y, and z for Point 1 and Point 2.
|
|
2
|
|
3
|
|
4
|
Add a Line Graph. For the data set, From parent uses the same data set as the plot group to which it belongs. Settings under y-Axis Data and x-Axis Data determine the quantity on those axes.
|
|
5
|
|
6
|
|
1
|
In the Model Builder, click a 3D Plot Group node to display the buttons available on the Plot Group contextual toolbar. On the main toolbar, click the cross-section buttons as needed.
|
The first time the cross-section toolbar buttons are clicked, a Cut Line 3D data set and a 1D Plot Group with a Line Graph are added to the Model Builder.
|
a
|
On the Plot Group contextual toolbar, click the First Point for Cut Line button (
|
|
b
|
Click the Second Point for Cut Line button (
|
|
d
|
|
a
|
|
c
|
|
a
|
|
c
|
|
2
|
Adjust the cut line as needed by clicking the buttons, then clicking the geometry to change its coordinates. The data set and plot group are updated automatically with the cut line data. Click the 1D Plot Group node to view the updates to the line graph.
|
|
|
|